Artificial Intelligence Survey
Experiment
Section 04
Survey Overview and Demographics
General Overview
Study Date: 29.09.23–04.11.23
Geographic Coverage: United States
Expertise:
- 25% Biology
- 22.9% Civil and Environmental Engineering
- 14% Geography
- 8.5% Public Health
- 16.1% Chemistry
- 13.6% Computer and Information Science
Response Overview
Sample Size: 777
Valid Responses: 232
Response Rate: 29.9
Date initial findings posted: 12.12.23
Most recent update: 12.12.23
Days survey in field: 37
Average response time: 7.4
Survey Demographics
Respondent Demographics:
- 35.2% Female
- 64.4% Male
- 100% Academic
- 0% Industry
Language(s): English
About the Experiment
We designed an experiment for a policy question asking about scientists’ attitude toward government regulation of generative AI to examine the effects of both question wording and the provision of a middle response option. Specifically, we examined question versions asking about regulation of AI that (a) did and did not mention ethical and unintended consequences of AI, and (b) did and did not provide for a middle response category between outright banning vs. not banning generative AI technology. Respondents were randomly assigned to be asked one of these four versions of this question.
Question
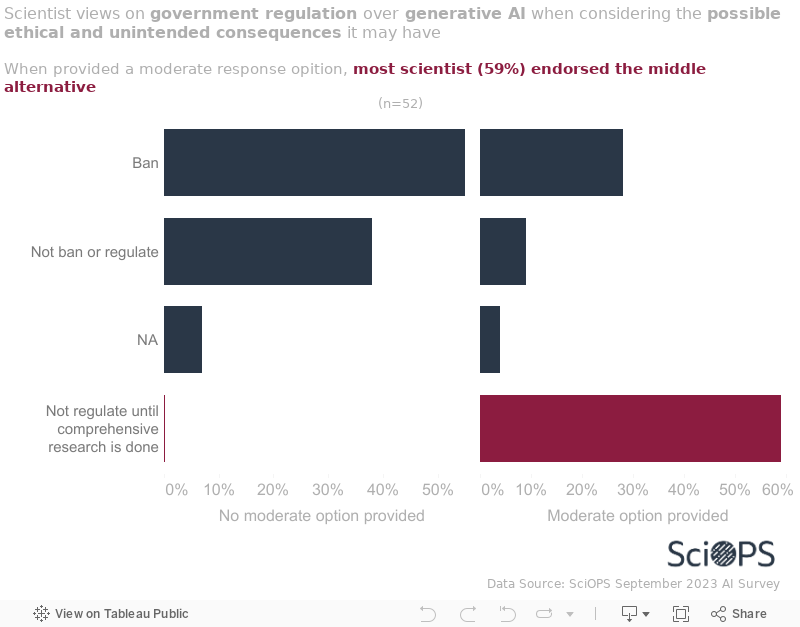
Which of the following is closest to your current point of view about the role of the government in regulating generative AI? (Version 1)
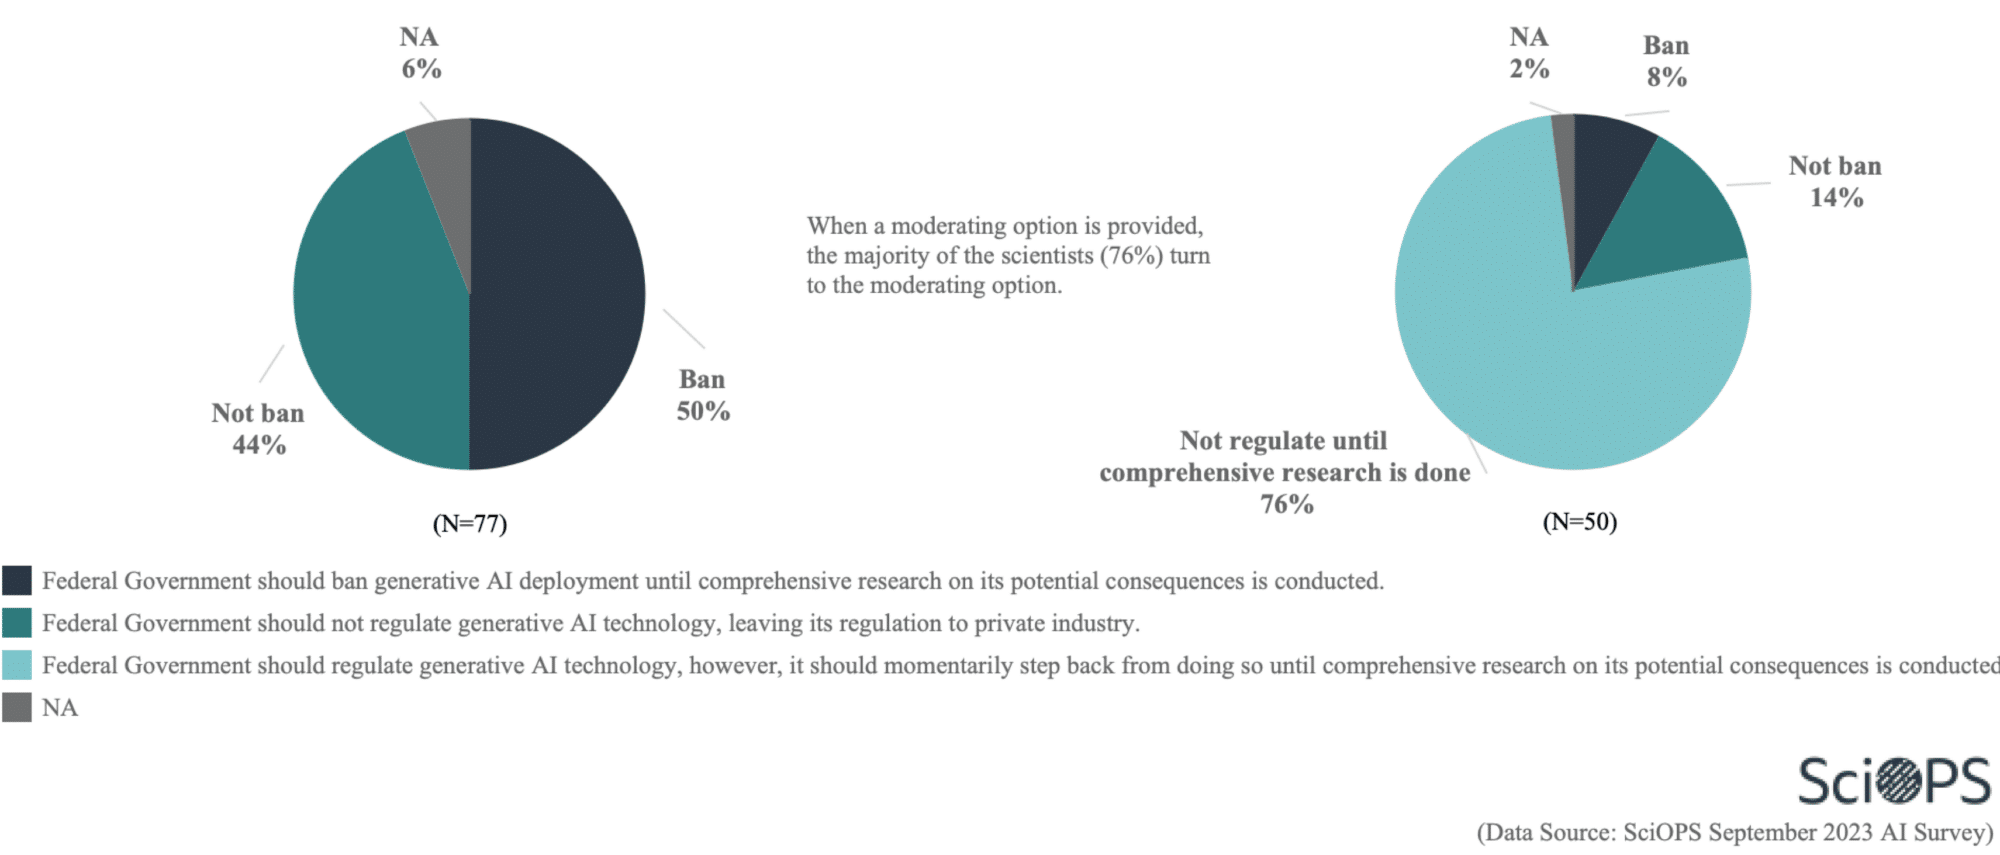
Finding
The graphs on the left shows responses of those that did not have a moderate answer choice. The graphs on the right shows responses of those that did have a moderate choice.
Question
Considering the possible ethical and unintended consequences generative AI may have, which of the following is closest to your current point of view about the role of the government in regulating generative AI? (Version 2)
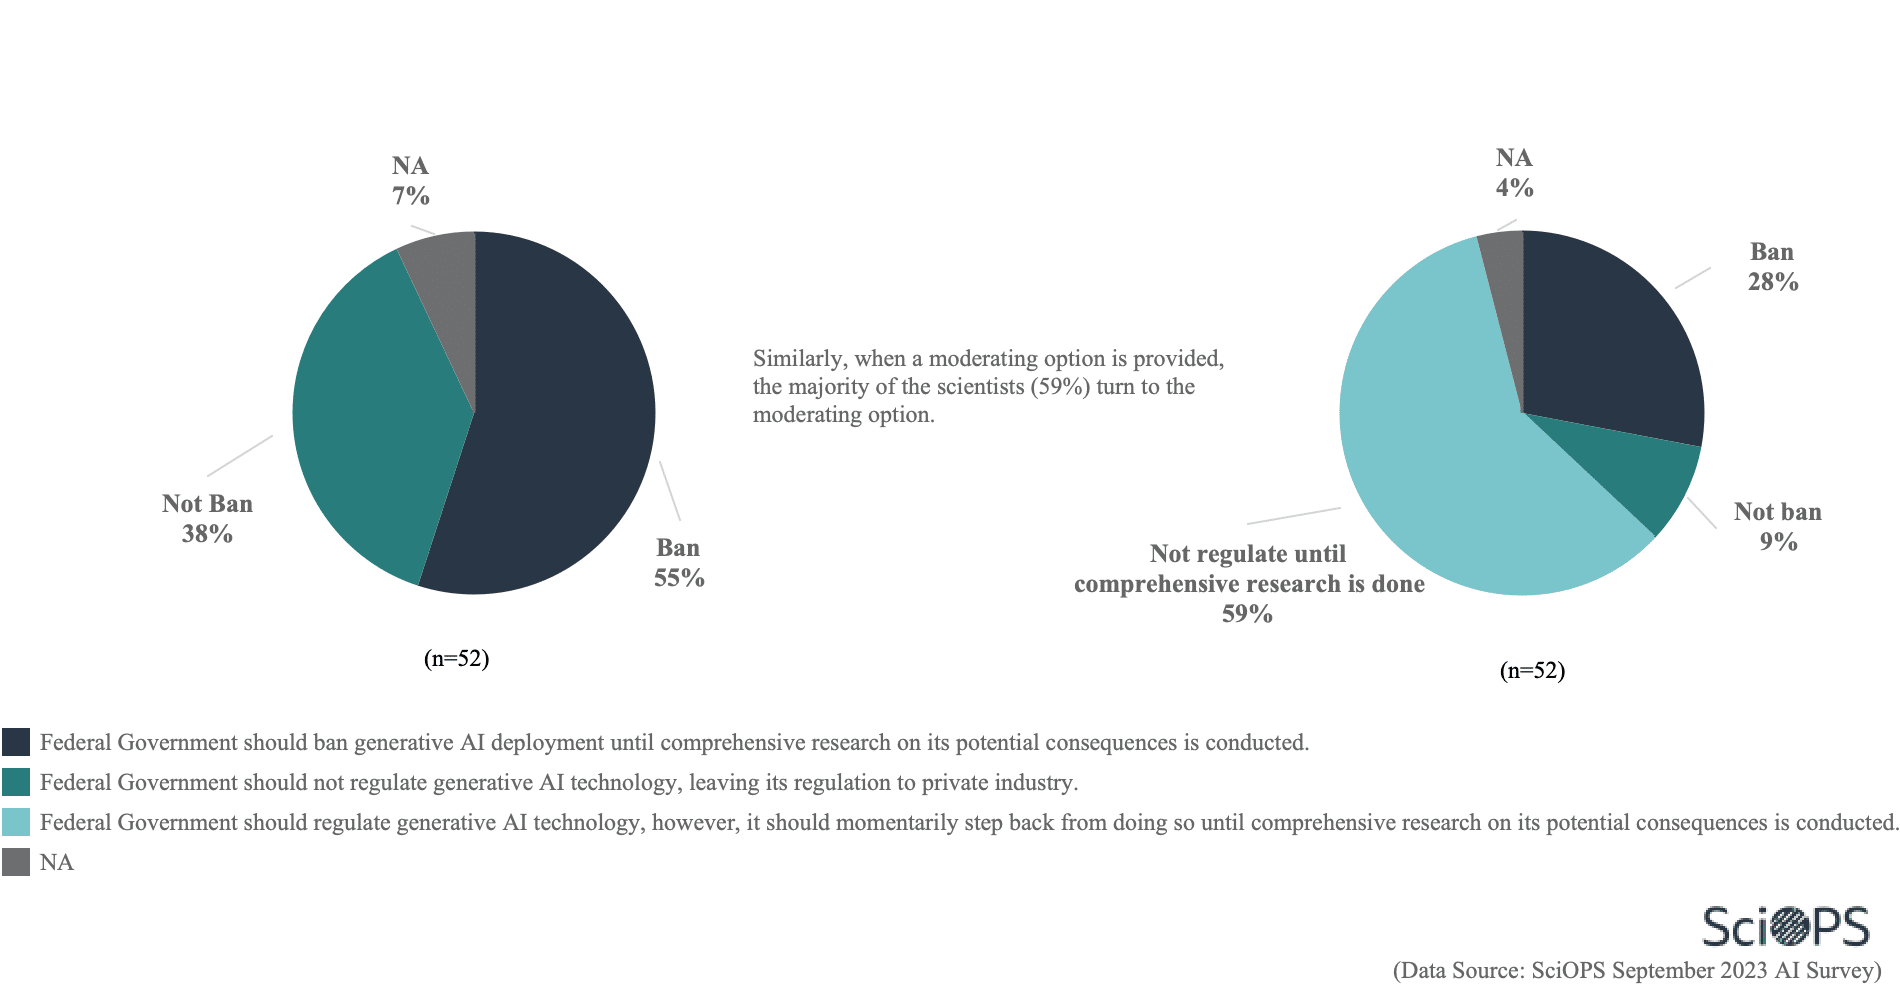
Finding
Overall, we find that when provided with a response option presenting a middle alternative regarding the extent to which the government should regulate generative AI technology for both question versions, the majority of scientists would endorse the middle alternative (76% and 59% for question versions 1 & 2, respectively) and the proportion in support of banning AI technology is reduced from 50% to 8% and from 55% to 28% in question versions 1 & 2 respectively. Likewise, support for not banning AI technology is also reduced (from 44% to 14% and from 38% to 9%, respectively, in the two question versions) when a middle option between outright banning vs. not banning AI is provided.
When the possible threats of generative AI are specifically mentioned (question version 2), more scientists approved the Federal Government banning generative AI deployment until comprehensive research on its potential consequences can be conducted, regardless of the provision of a middle response option: (50% to 55% when no middle option is provided, and 8% to 28% when a middle option is provided).
Additionally, scientists were somewhat more likely to avoid answering the question when not provided with the more moderate middle response option (from 2% to 6%, and from 4% to 7% across question versions 1 & 2, respectively).
This national survey of academic scientists in the US was conducted by the Center for Science, Technology and Environmental Policy Studies (CSTEPS) at Arizona State University. The survey was approved by the Institutional Review Boards at Arizona State University.
The sample for this survey was selected from our SciOPS panel. The SciOPS panel was recruited from a random sample of PhD-level faculty in six fields of science. Contact information of faculty in the fields of biology, geography, civil and environmental engineering, chemistry, and computer and information science and engineering was collected from randomly selected Carnegie-designated Research Extensive and Intensive (R1) universities in the United States (US).
Contact information for academic scientists, social scientists and engineers in the field of public health was collected from all Council on Education for Public Health (CEPH) accredited public health schools. The full sample frame for recruiting the SciOPS panel includes contact information for 18,505 faculty members of which 1,366 agreed to join the SciOPS panel. This represents an AAPOR recruitment rate (RECR) of 7.5% (RR4).
Sample weighting and precision: The sample of respondents for this survey was weighted by the inverse of selection probabilities and post-stratified probabilities by gender, academic fields, and academic ranks to represent the full sample frame for recruiting SciOPS panel members as closely as possible. A conservative measure of sampling error for questions answered by the sample of respondents is plus or minus 6 percentage points